DAQ Dashboards and Plots
A DAQ (data acquisition) dashboard is a set of plots drawn from the loaded recording. syn.bike comes with four presets, and you can build your own. To load a recording first, see Data Acquisition.
Choose a Dashboard
The Dashboard picker sits at the top of the sidebar on both tabs. It lists the presets, then any dashboards saved to your account or your team, then Create New +.
| Preset | Plots |
|---|---|
| Basic | Position (front, rear and shock travel against time), Velocity (front shaft, rear wheel and shock shaft speed against time) and Map. |
| Suspension Analysis | Travel and Velocity histograms, a Summary with a card each for the front, the shock, the rear and GPS speed, Map, Front Balance and Rear Balance. |
| Frequency | Spectrum (PSD) of the front and frame vertical accelerometers, Transmissibility between the wheels, frame and handlebar, and Harshness at the bar and frame against time. |
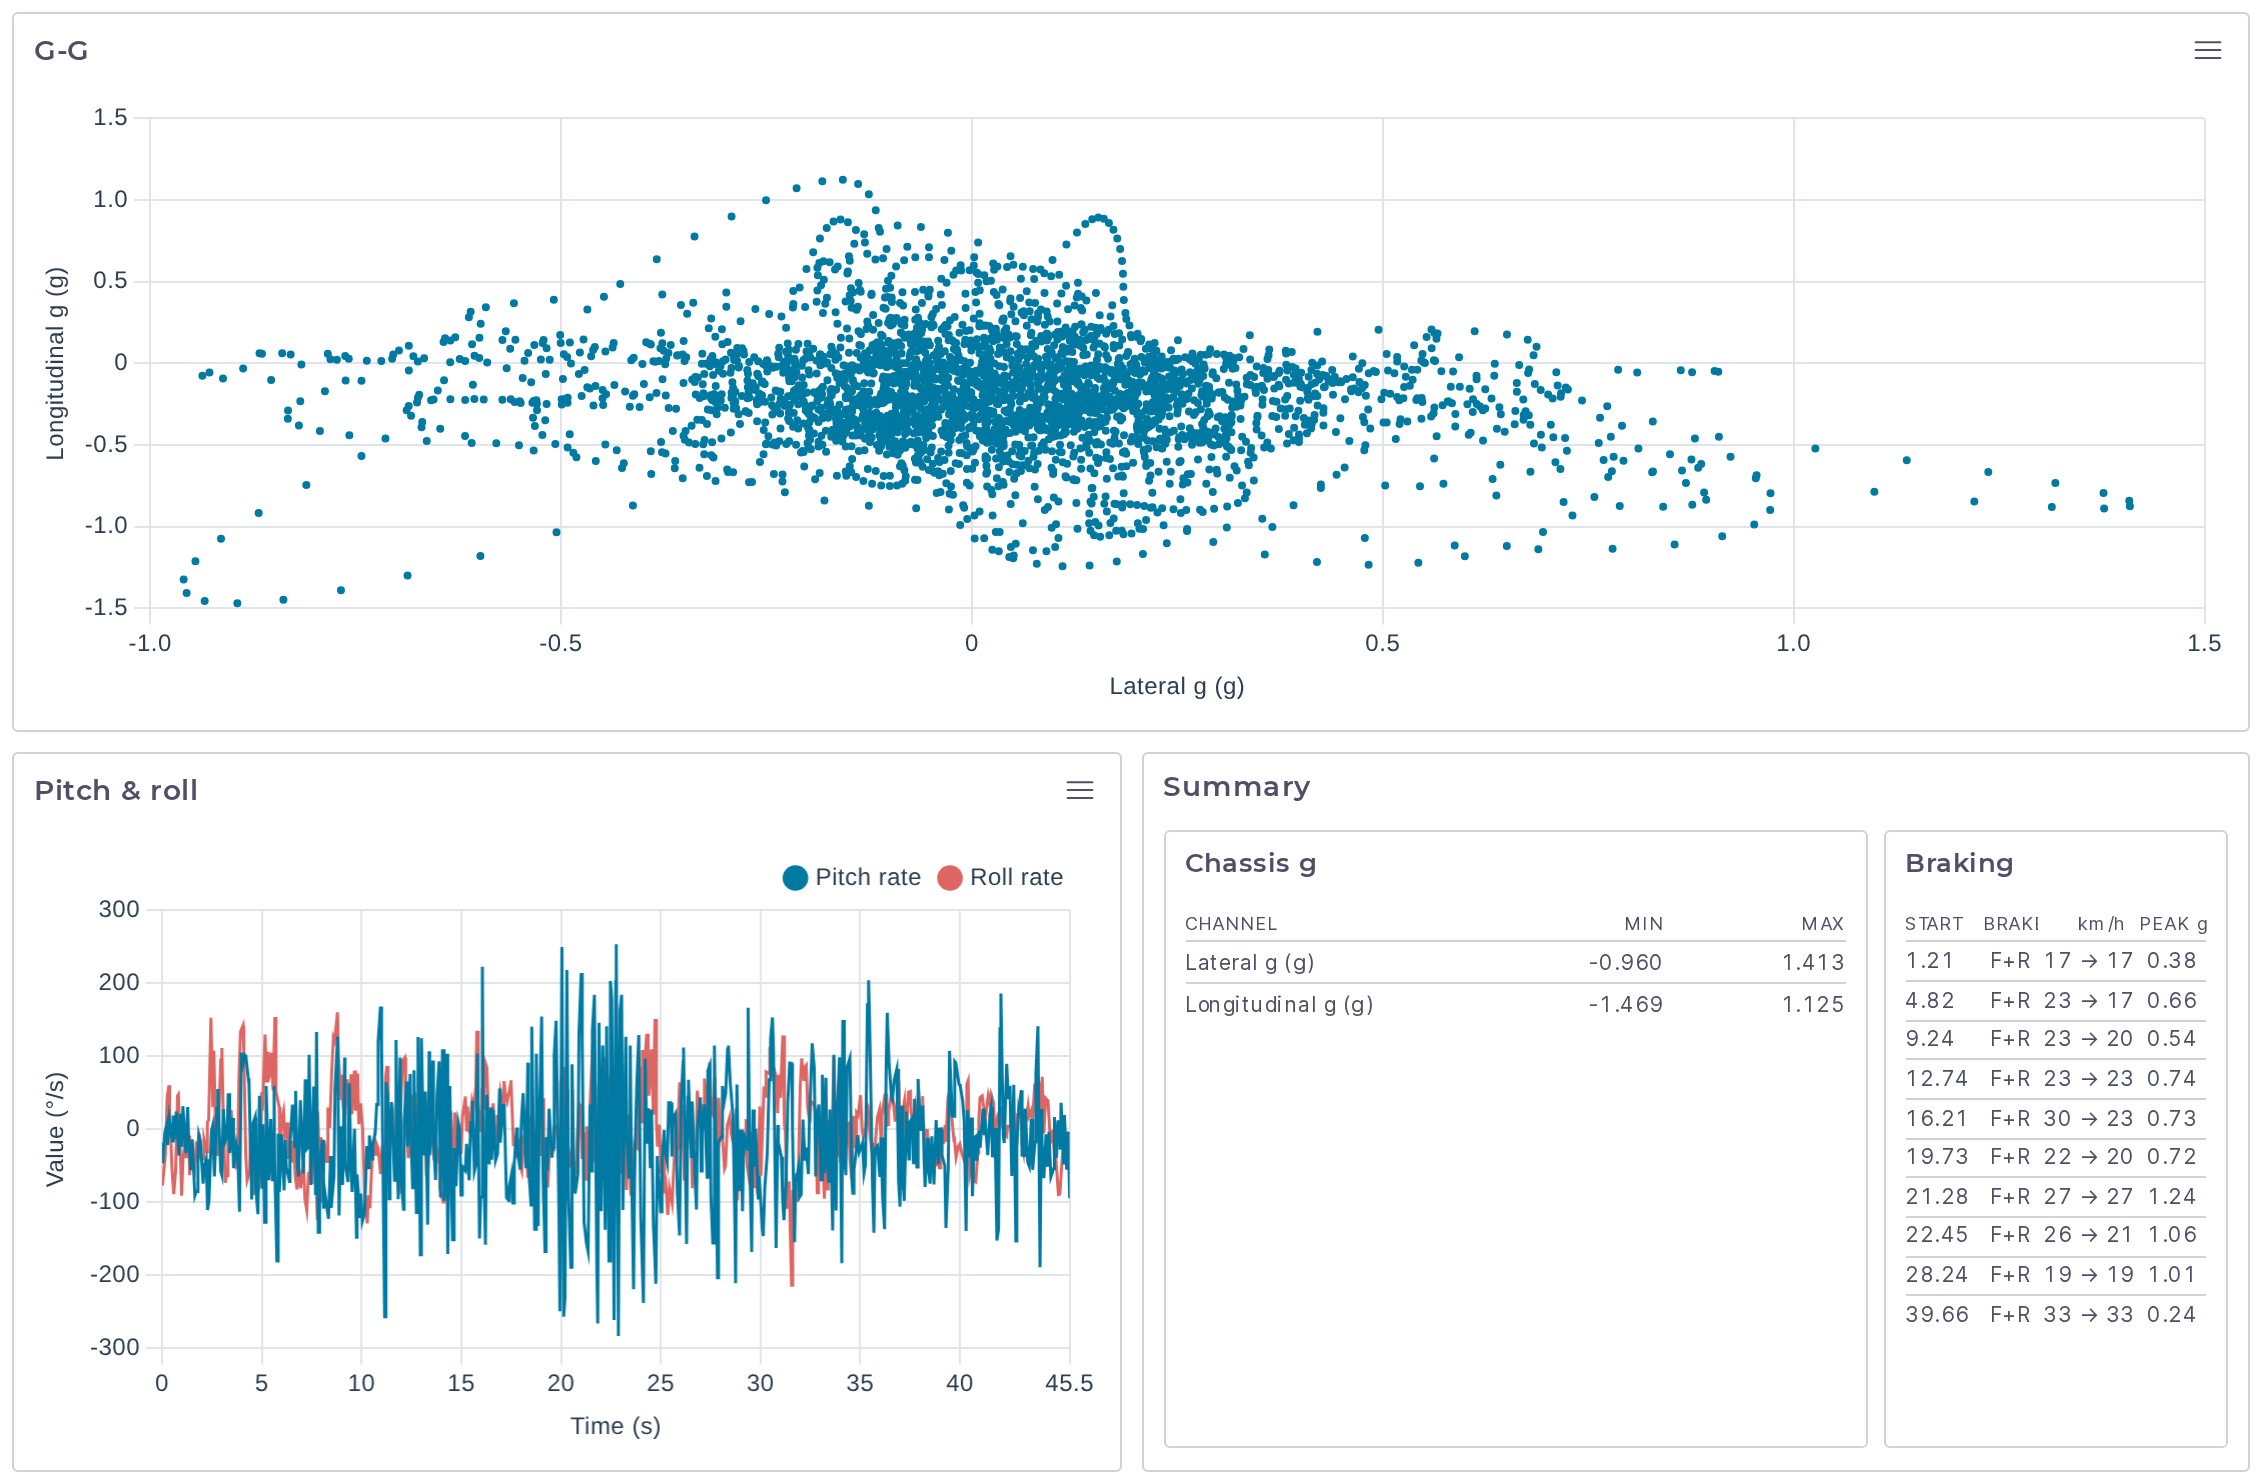
| Chassis | G-G (lateral against longitudinal acceleration), Pitch & roll rates against time, and a Summary with the acceleration range and a braking table. |
Your choice is saved to your account.
Select a Time Range
The strip across the top of the page is a minimap of the whole recording, showing Front travel and Rear travel. Dashed markers labeled F1, F2 and so on mark each press of the logger's flag button.
- Drag across the minimap to select a range.
- Double-click it to go back to the whole recording.
- Click a row in an events or braking table to select that event.
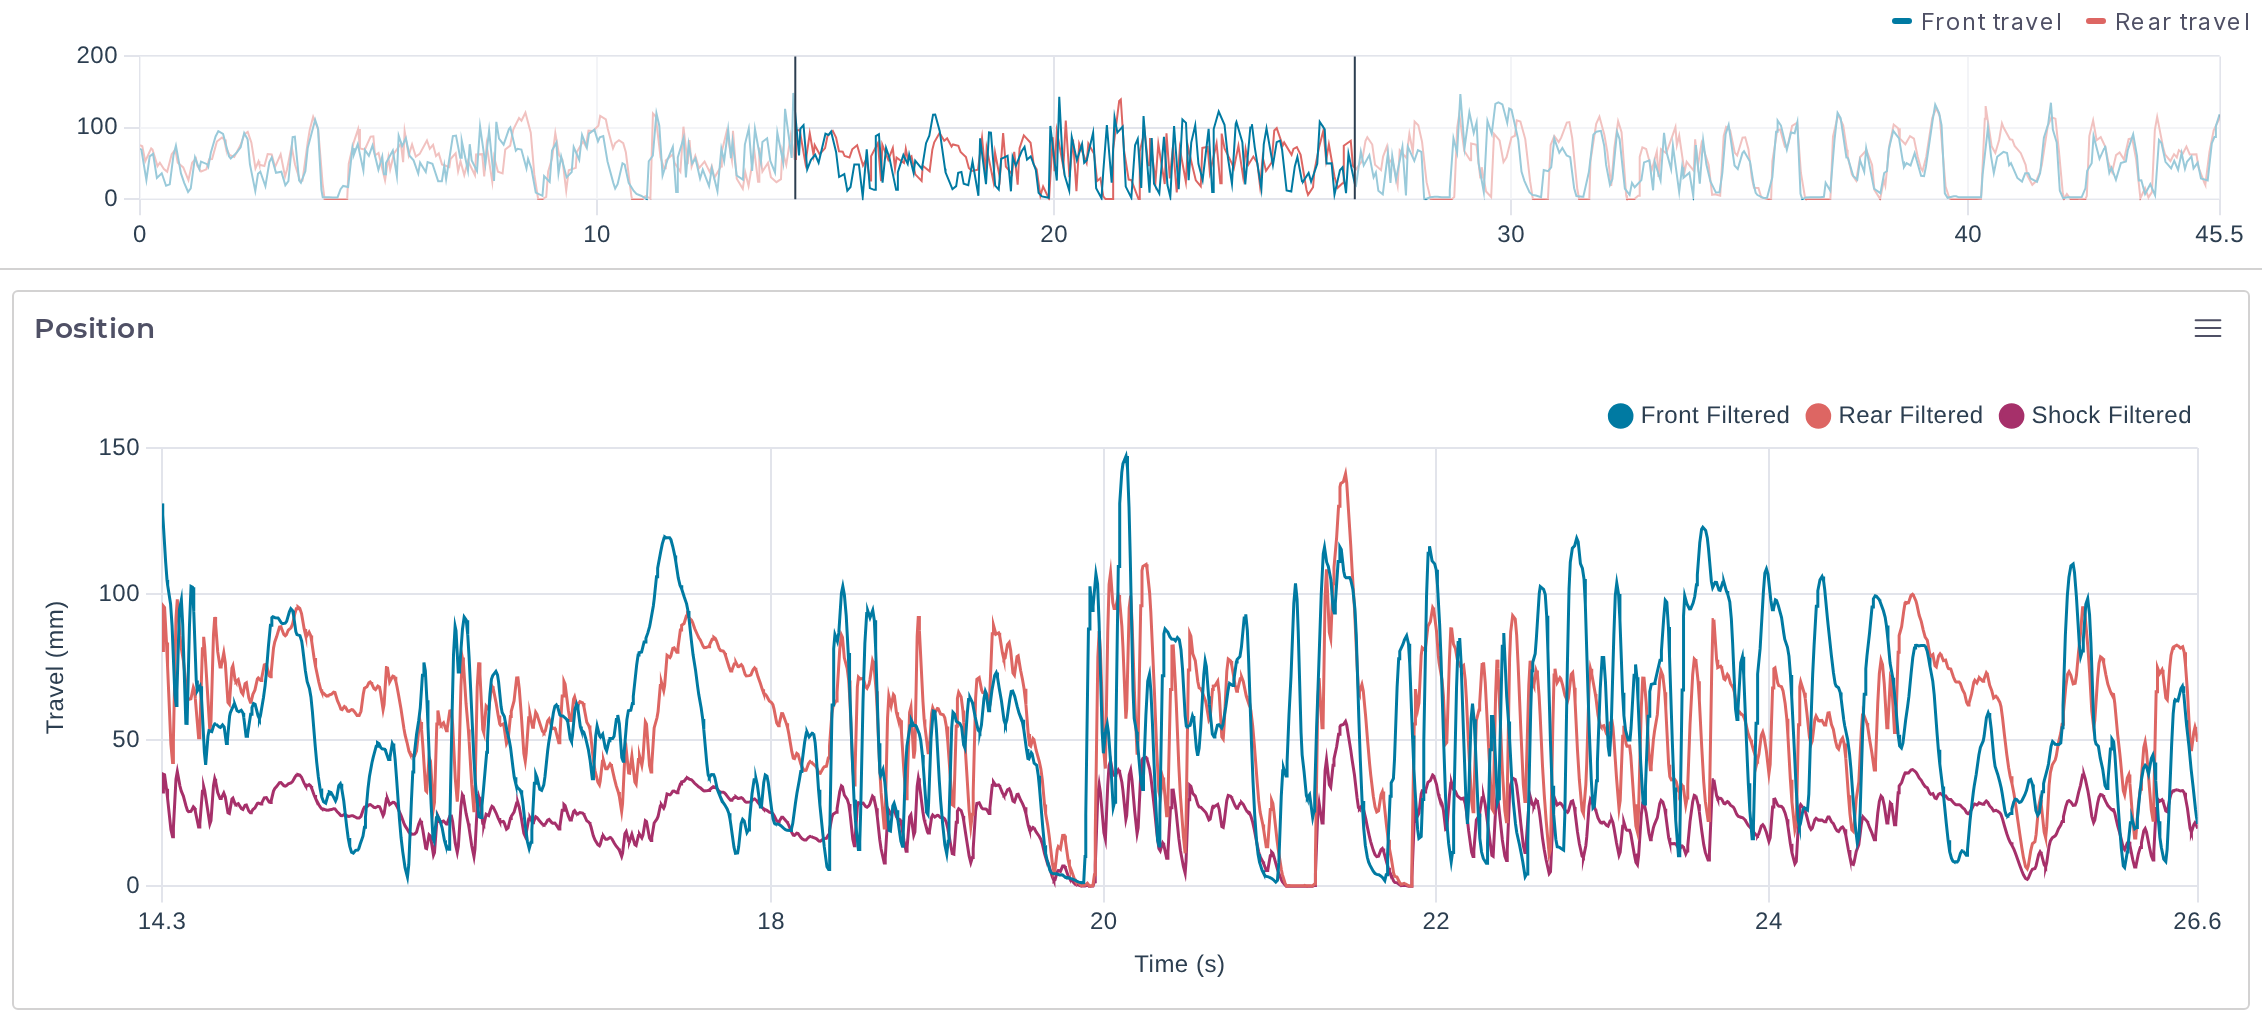
The selection drives every plot. Time plots zoom to it, the map highlights that part of the route, and histograms, summaries, balance plots and spectra use only the samples inside it.
The plots have no zoom of their own. Hovering over one time plot shows a crosshair at the same instant on the others.
Read the Plots
Line and Scatter Plots
A line plot draws one or more channels against time, like Position and Velocity in Basic. Velocity is positive in compression and negative in rebound.
A scatter plot draws one channel against another. The G-G plot in Chassis is Longitudinal g against Lateral g at the frame. The outline of the cloud shows how much cornering and braking acceleration the rider used.
Histogram Plots
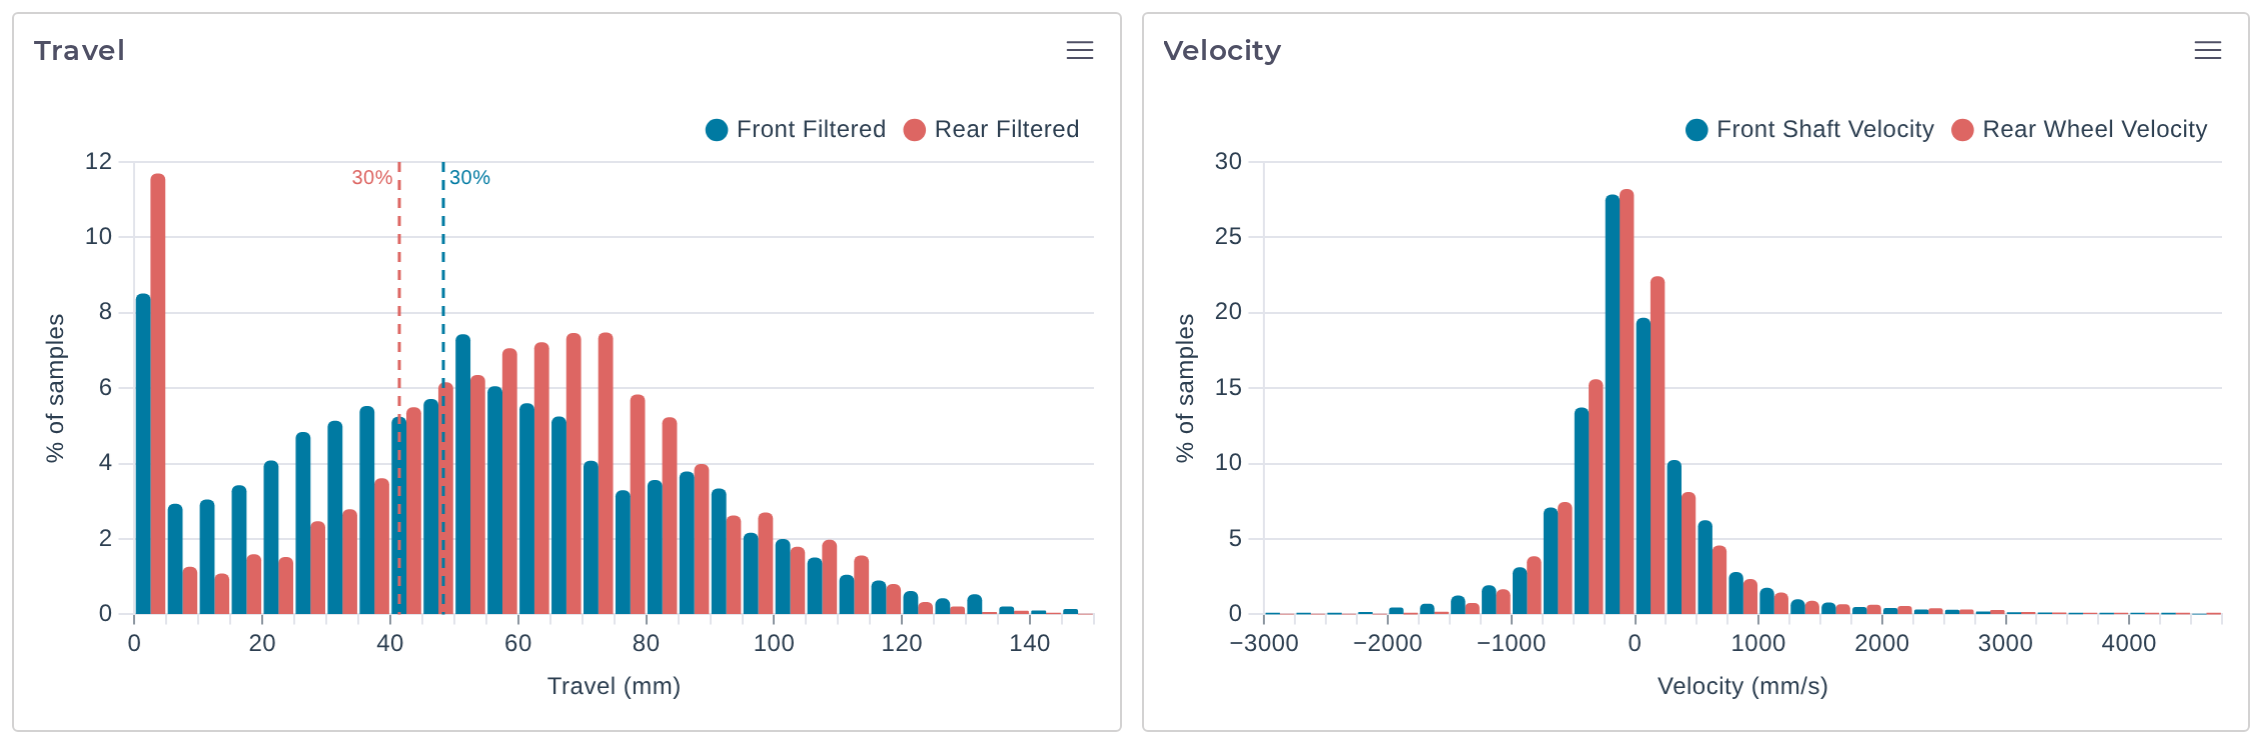
A histogram shows what share of the samples fell in each band of a channel's range. The vertical axis is % of samples, and several channels are drawn side by side in each band.
On a travel histogram, a dashed line marks 30% of each end's total travel as a sag reference. A fork that sits well short of the line while the rear sits past it is riding nose-high, and the other way round.
On a velocity histogram, compression is to the right of zero and rebound to the left. Dashed guides mark zero and the Speed zone split on each side (250 mm/s by default), dividing the plot into HSR (high-speed rebound), LSR (low-speed rebound), LSC (low-speed compression) and HSC (high-speed compression).
Summary Plots
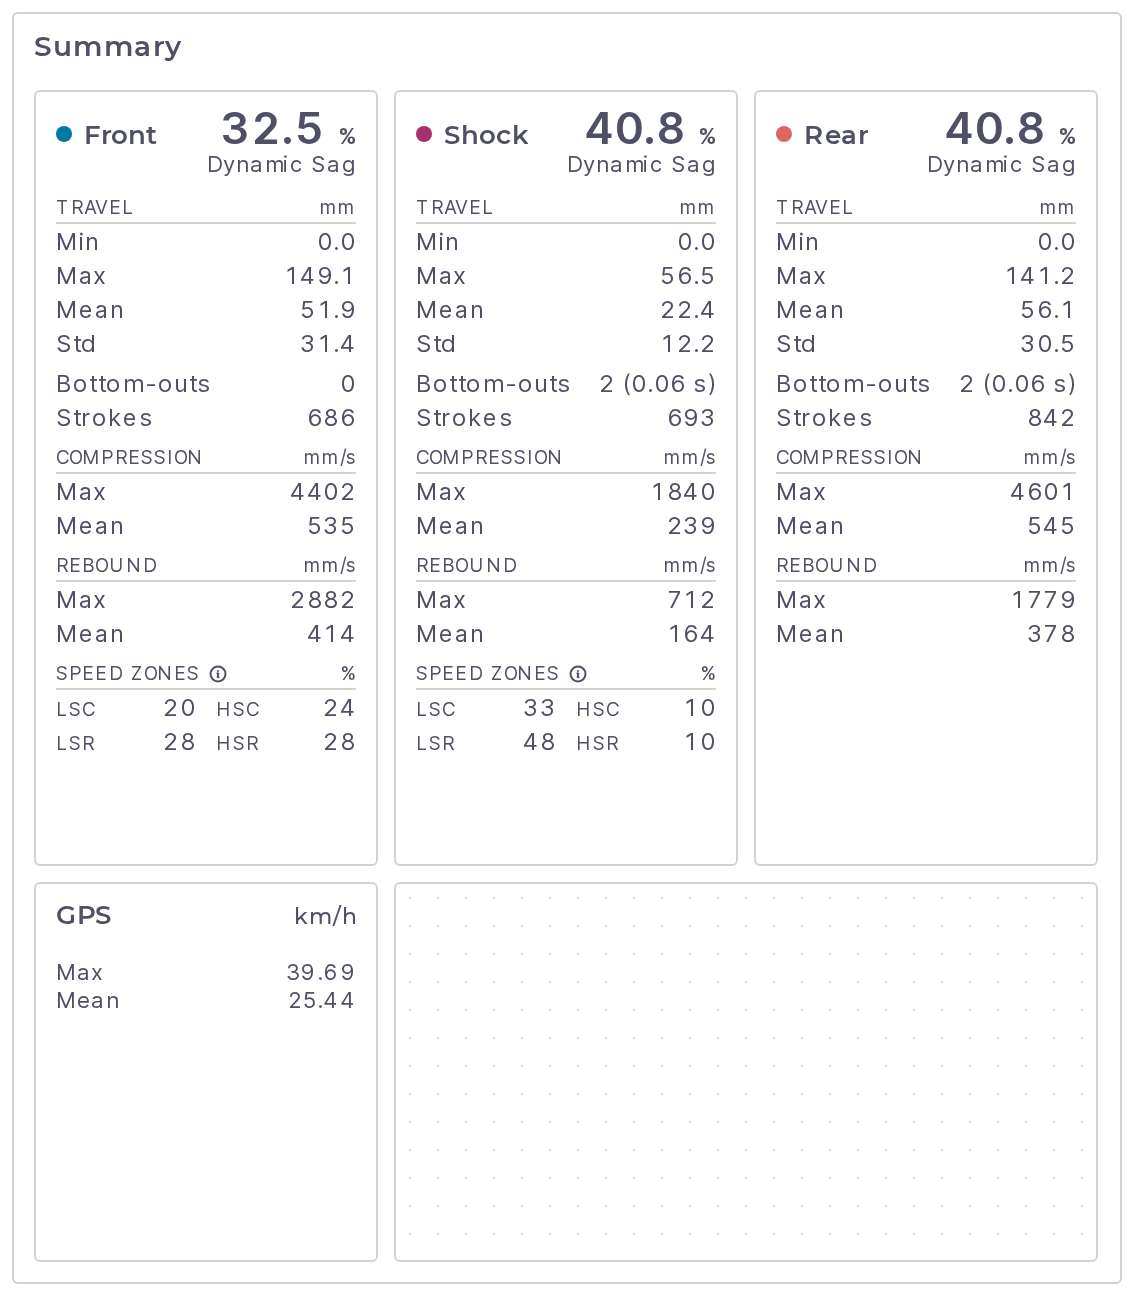
A summary is a row of cards with numbers for the selected range. The suspension cards (Front, Rear, Shock) can show:
| Value | Meaning |
|---|---|
| Dynamic Sag | Mean travel as a percentage of that end's total travel. |
| Travel | Minimum, maximum, mean and standard deviation, in mm. |
| Bottom-outs | How many times travel went above the Bottom-out threshold (%) (95 by default), with the total time spent above it. 2 (0.06 s) is two bottom-outs lasting 0.06 s in all. |
| Strokes | The number of compression and rebound strokes detected. |
| Compression and Rebound | Maximum and mean speed in each direction, in mm/s. |
| Speed Zones | For the front and the shock, the share of shaft-speed samples in low-speed compression (LSC), high-speed compression (HSC), low-speed rebound (LSR) and high-speed rebound (HSR), split at the Speed zone split. |
The other card kinds:
| Card | Shows |
|---|---|
| Channels | Statistics for any channels you pick: Min, Max, Mean, Median, Std, RMS, P5 and P95, with an optional distribution sparkline. |
| Run | Distance (from GPS), Moving speed, Moving time, Air count and Air time. Moving means 7.2 km/h or faster, and air is both ends under 5% travel for at least 0.25 s. |
| Events | A table of airs and front and rear bottom-outs with the start time, duration and speed of each. |
| Braking | A table of braking events: when each started, which brake was used (F+R for both), the speed at the start and end, and the peak deceleration in g. A brake counts as applied while its sensor reads below the Brake threshold (counts). |
Balance Plots
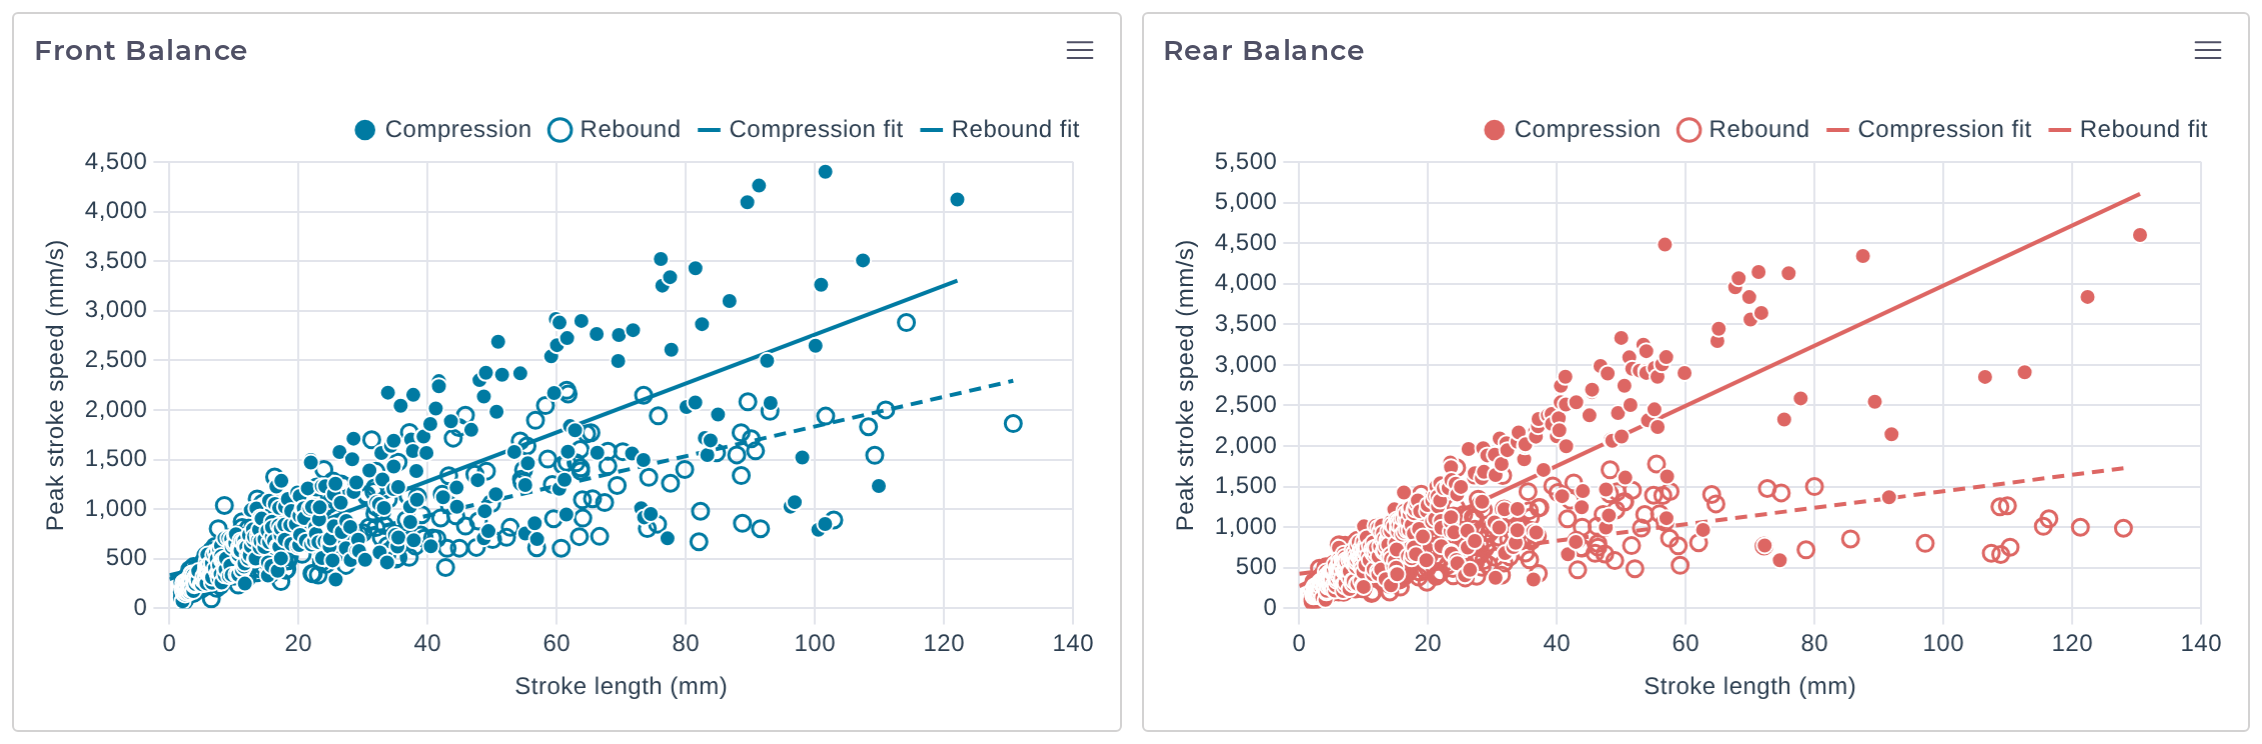
A balance plot has one point for every stroke in the selected range: the stroke's length in mm along the bottom and its peak speed in mm/s up the side. Compression strokes are solid points and rebound strokes are hollow, each with a fitted line (Compression fit and Rebound fit, the rebound one dashed).
The slope of a fitted line is how fast that end moves for a given size of hit. Compare Front Balance with Rear Balance: a much steeper line at one end means that end is moving faster through the same bumps.
Only strokes that start and finish inside the selected range are counted, and a fit needs at least two strokes of different lengths.
Spectrum (PSD)
A spectrum shows how a channel's vibration is spread across frequency, as power spectral density on logarithmic axes. The Frequency preset compares the front and frame vertical accelerometers from 1 to 200 Hz, in g²/Hz. A peak is a frequency the bike is being shaken at. Where the frame line sits below the front line, the suspension and chassis are taking that vibration out.
The footer gives the frequency resolution and the number of averaged segments, for example Δf 0.49 Hz · 43 segments. A longer selection gives a smoother curve. One that is too short shows "Select at least 0.6 s for a spectrum".
Transmissibility
Transmissibility is the ratio between two accelerometers at each frequency, plotted from 1 to 100 Hz with a dashed line at 1. Above the line the output moves more than the input. Below it, the vibration is being reduced on the way through.
The preset shows Frame ÷ Front Z, Frame ÷ Rear Z and Handlebar ÷ Frame Z. Shaded bands mark three ranges, and the table under the chart gives each pair's ratio in them:
| Band | Range |
|---|---|
| Body | 5–15 Hz |
| Hop | 15–30 Hz |
| Chatter | 30–60 Hz |
A cell with a warning icon has low coherence: the two sensors were mostly not moving together in that band, so treat the value with suspicion. Its tooltip reads, for example, "Coherence 0.12 — most vibration here comes from other sources, so this ratio overstates what passes through".
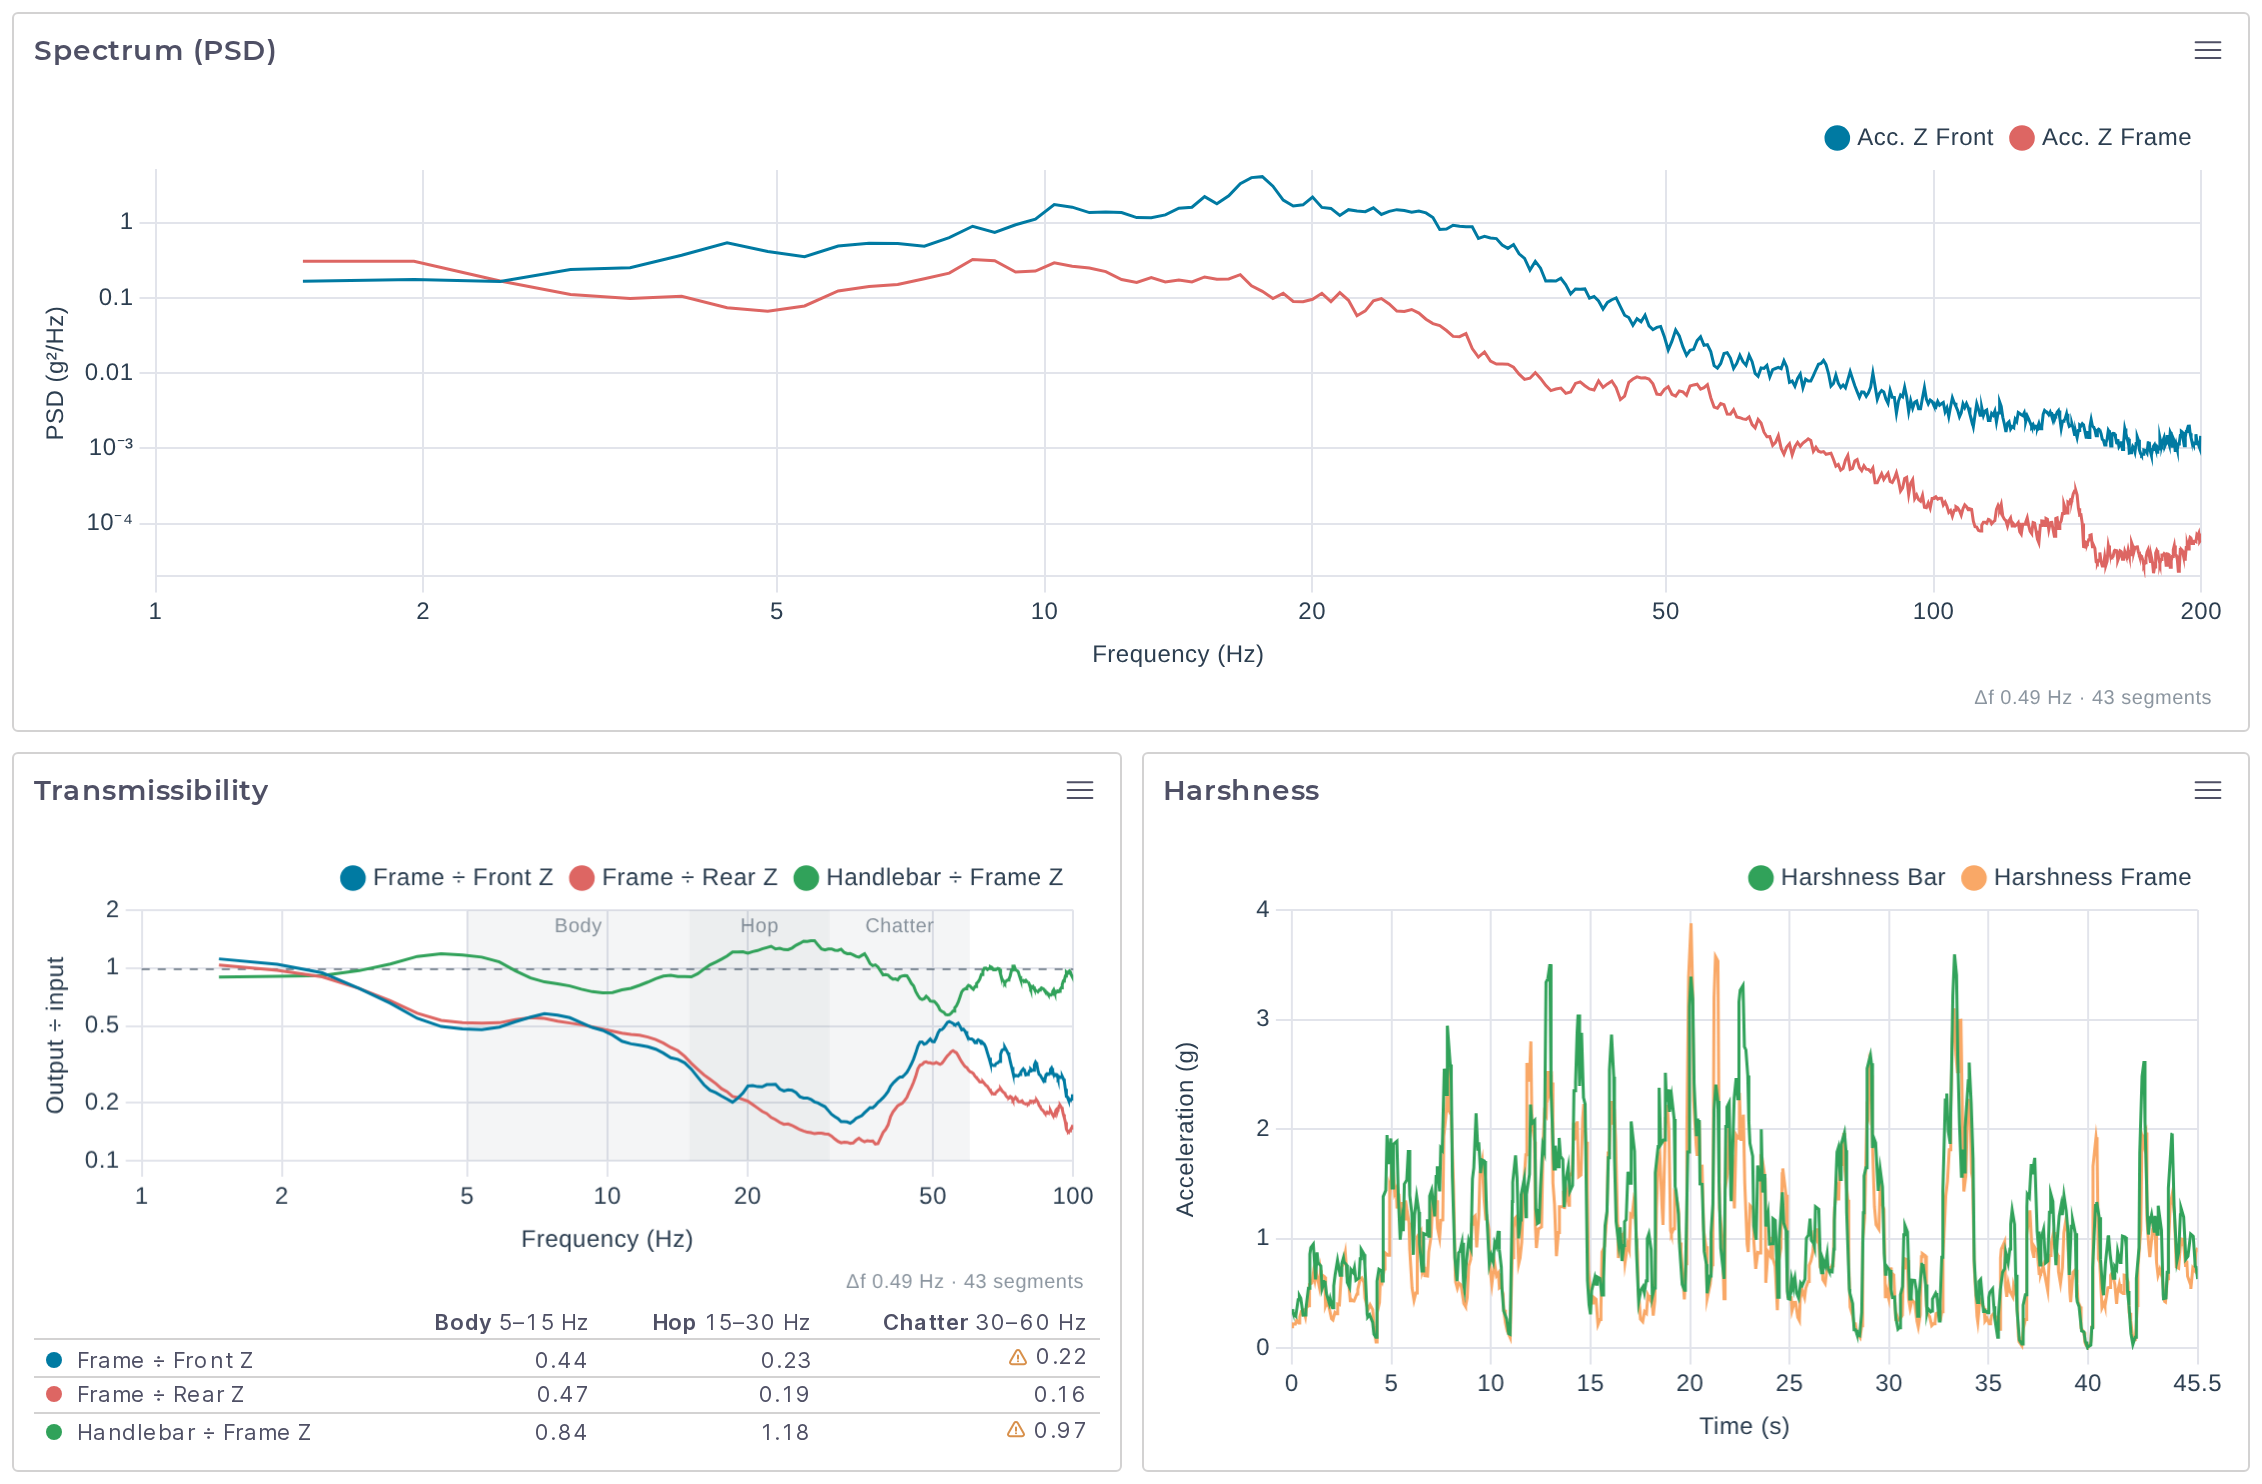
Harshness, the third plot in the Frequency preset, is a line plot of Harshness Bar and Harshness Frame against time. Both channels are described under DAQ Channels.
Route Map
The map draws the GPS route, with the selected time range highlighted. Scroll with Ctrl held to zoom, or pinch on a trackpad.
- The buttons at the top right are Zoom in, Zoom out, Fit route, Reset north and Map layers.
- The layers panel switches the style between Auto, Light, Dark and Color, turns Place labels, Points of interest, Route and Selected range on or off, and adds Hillshade, Contours and 3D terrain.
- The Colour by… picker at the bottom right colors the selected stretch of the route by a travel, velocity, IMU (inertial measurement unit), GPS or brake channel, from blue (low) through yellow to red (high).
A recording without GPS shows "No GPS fix in this recording".
DAQ Channels
A recording only offers the channels its sensors produced. The rest are marked "not in this recording" in the plot editor.
| Channel | Unit | What it is |
|---|---|---|
| Front Filtered, Rear Filtered, Shock Filtered | mm | Fork travel, rear wheel travel and shock stroke after the low-pass filter. |
| Front Raw, Rear Raw, Shock Raw | mm | The same travel before filtering. |
| Front Shaft Velocity, Rear Wheel Velocity, Shock Shaft Velocity | mm/s | Rate of change of the filtered travel, positive in compression. |
| Rear Travel Bias | % | Rear travel used minus front travel used, each as a percentage of its total, averaged over 0.5 s. Positive means the rear is deeper in its travel than the front. |
| Acc. X, Acc. Y, Acc. Z for Front, Rear, Frame and Handlebar | g | Raw accelerometer axes. |
| Gyro X, Gyro Y, Gyro Z for the same four locations | rad/s | Raw gyro axes. |
| Harshness Bar, Harshness Frame | g | Vertical vibration above 15 Hz, as an RMS over a rolling 0.25 s window. |
| Lateral g, Longitudinal g | g | Frame acceleration across and along the bike, low-passed at 3 Hz. |
| Pitch rate, Roll rate | °/s | Frame rotation rates. |
| GPS Speed | km/h | Speed from the GPS. |
| Front Brake, Rear Brake | Whether each brake is applied. | |
| Front Sensor (ADC), Rear Sensor (ADC), Brake 1, Brake 2 | counts | The raw sensor readings from the logger's ADC (analog-to-digital converter). |
For how travel comes from the sensors, see How Sensor Travel Becomes Wheel and Shock Travel.
Build Your Own Dashboard
Presets cannot be changed. Start an empty dashboard or copy a preset. Every change you make to a dashboard is saved as you make it.
- Private dashboards belong to your account.
- Team dashboards are shared with your team and need write permission in that team.
- Public dashboards, if any are listed, are published by syn.bike and are read-only.
Create or Copy a Dashboard
To start empty, choose Create New + in the Dashboard picker, enter a Name, choose where to save it under Save to if you belong to a team, and click Create.
To start from a preset, select it and click the copy icon beside the picker (Duplicate to Private to edit). The copy is saved to your private dashboards (or to your team's, when the tooltip reads Duplicate to Team to edit) and selected.
With one of your own dashboards selected, the pencil icon (Edit dashboard) opens Edit Dashboard, where you can rename it, move it with Position in list, or delete it. Deleting a dashboard deletes its plots and cannot be undone.
Add and Edit Plots
Click the + beside the picker (Add plot), or open a plot's menu and choose Edit plot. Give the plot a Name, pick its Type, and fill in the settings for that type.
| Type | Settings |
|---|---|
| Line, Scatter | X axis and one or more Channels, each with its own color. |
| Histogram | Channels, Bins (5 to 200, default 30) and Range: Auto fits the data, Fixed uses the Min and Max you enter. |
| Balance | Channel: Front or Rear. |
| Summary | One or more Cards. Each has a Title, a Kind, and the fields, stats or channels to show for that kind. |
| Map | None. |
| Spectrum (PSD) | Up to 6 Channels that share a unit, and the frequency span as Min Hz and Max Hz (0.5 to 1000, default 1 to 200). |
| Transmissibility | Up to 4 Output ÷ Input pairs. |
Click Add Plot or Save to finish. Delete in the same window removes the plot, after a confirmation.
The window does not save an incomplete plot and tells you what is missing, for example "Add at least one channel".
Arrange Plots
On a dashboard you can edit:
- Drag a plot by its title strip to move it, or focus the title and press
Alt+Arrow. A row holds one to four plots. - Drag the gap between two plots to change how the row's width is shared.
- Drag the handle under a row to change its height, from
200to920px (new rows are360px). Double-click the handle to reset it. - Reorder the cards inside a summary the same way as plots.
Export a Plot
Open the menu at the top right of a plot and choose Export PNG to save it as an image. Summaries and maps cannot be exported. For the numbers behind the plots, see Export the Processed Data.
When a Plot Is Empty
| Message | What to do |
|---|---|
| "This recording has none of the selected channels." | The recording does not contain the sensors this plot uses. Check COLUMNS IN FILE in the diagnostics. |
| "No samples in the selected range." | Widen the range on the minimap. |
| "No complete front strokes in this range." | Widen the range, or lower Stroke threshold (mm/s) or Min stroke (mm) under Advanced Processing Settings. |